- Home
- Contact Us
- News & Events
- Awards
- AAEES Awards Criteria
- 40 Under 40 Recognition Program
- Edward J.Cleary Award
- Excellence in Environmental Engineering and Science Education
- Gordon Maskew Fair Award
- Honorary Member
- International Honorary Member
- Ralph and Joe Bales Graber Science Award
- Stanley E. Kappe Award
- Environmental Communications Awards Competition
- Excellence in Environmental Engineering and Science Competition
- The AAEES Chapter Blue Marble Award
- Resources
- AAEES Microcredentials
- Annual Reports
- AAEES Press Releases
- AAEES Website How To VIdeos
- Environmental Engineer and Scientist
- Environmental Engineering Body of Knowledge
- PFAS Resources
- Specialty Examination Guide
- Students and Young Professionals Resources
- Who's Who in Environmental Engineering & Science®
- Leadership Opportunities
- Membership
- Donate
- Jobs
2023 Excellence in Environmental Engineering and Science® Awards Competition Winner
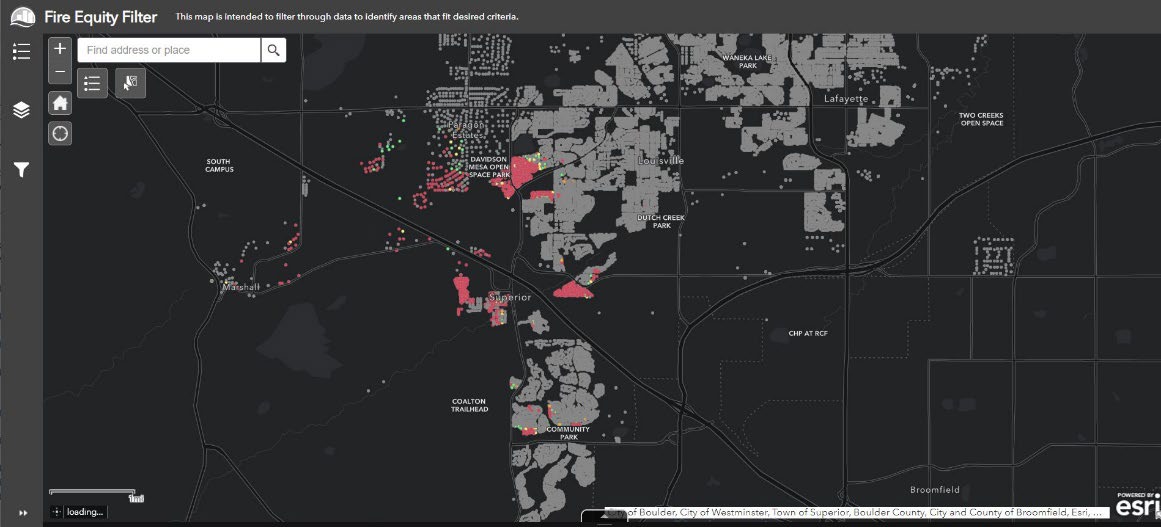
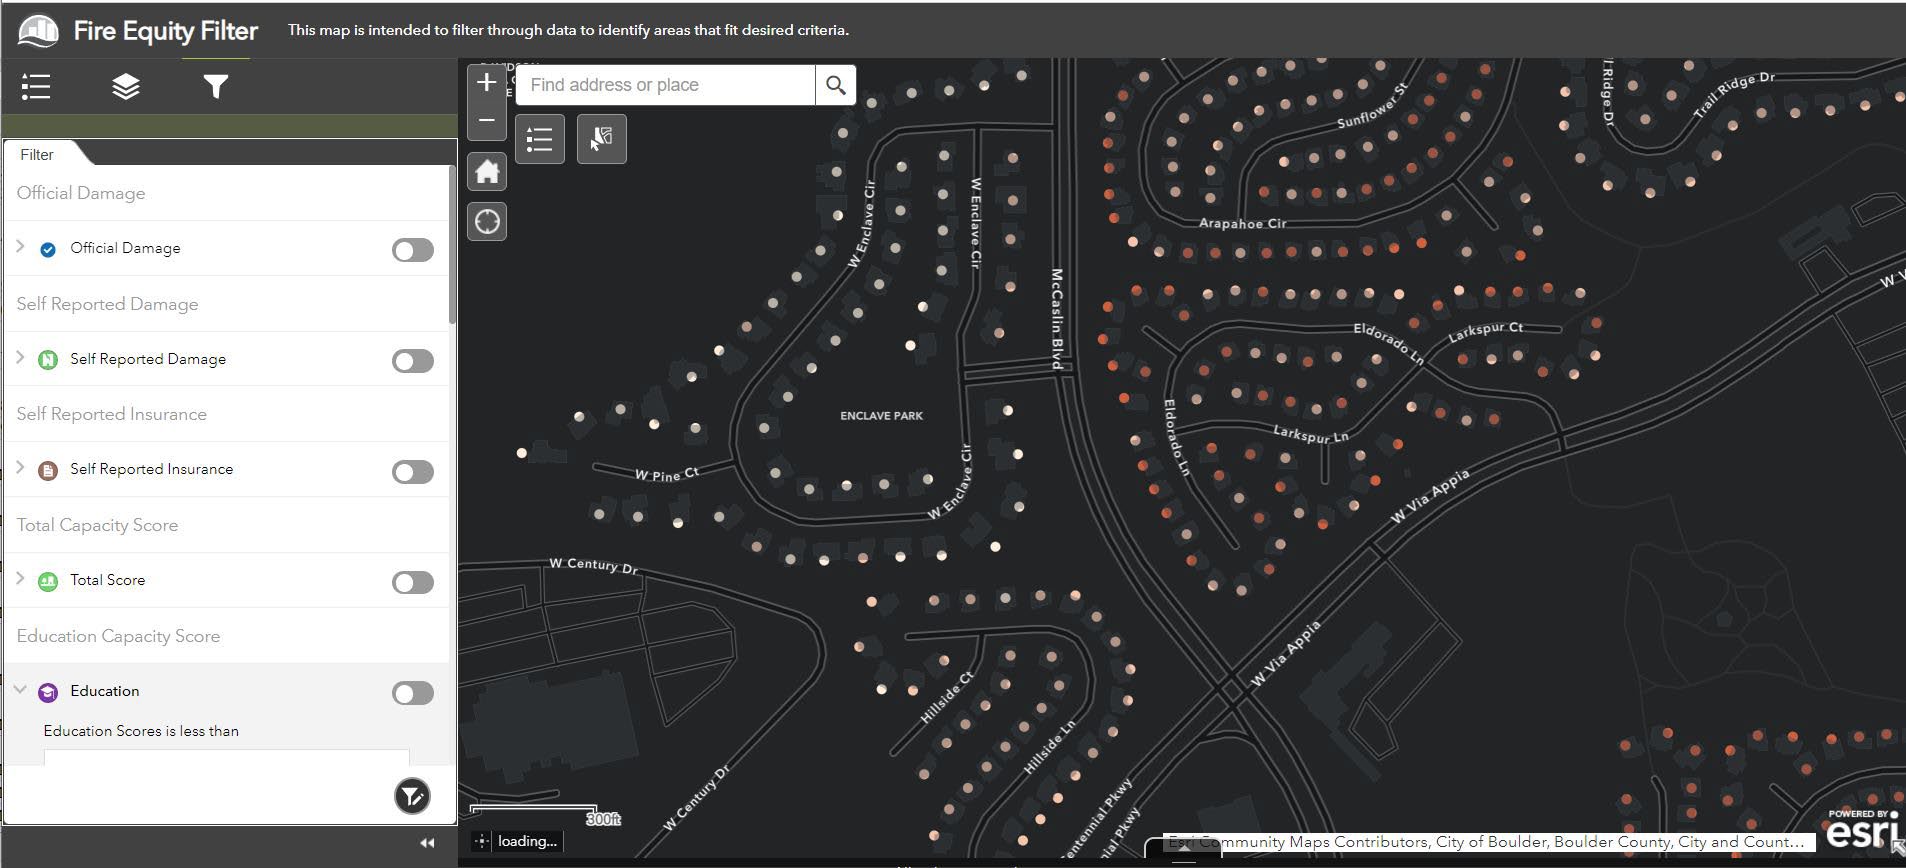
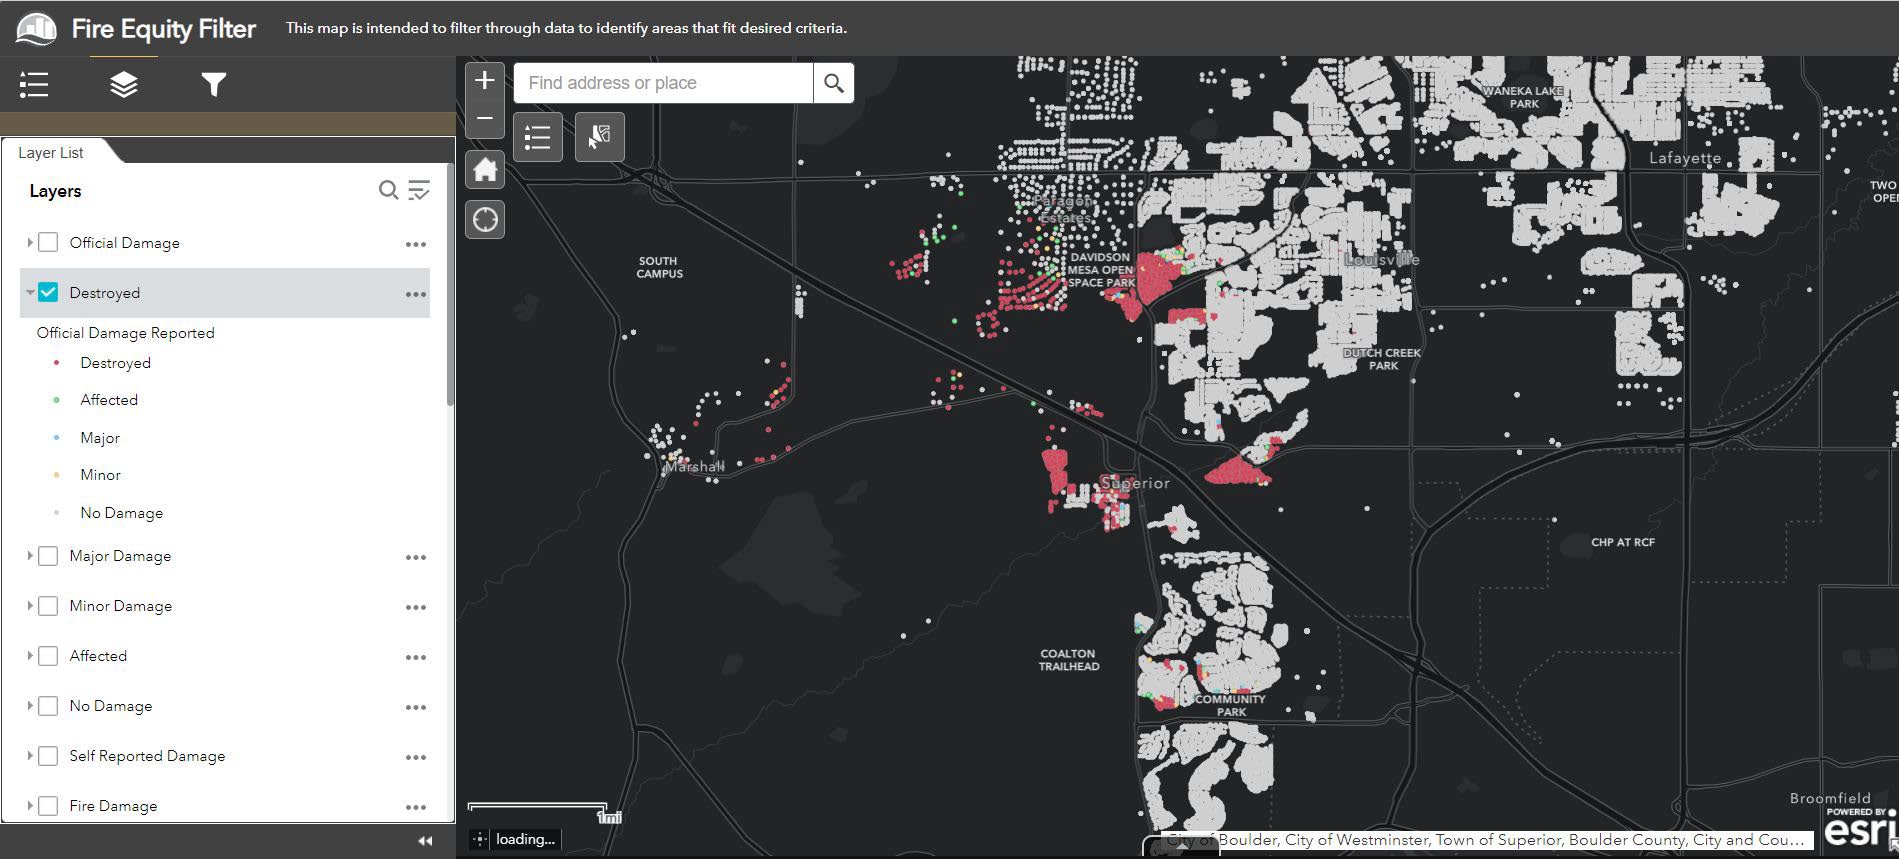
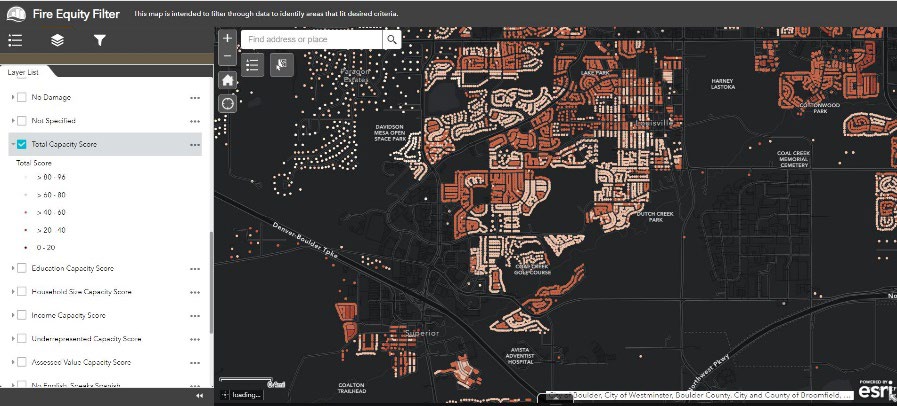
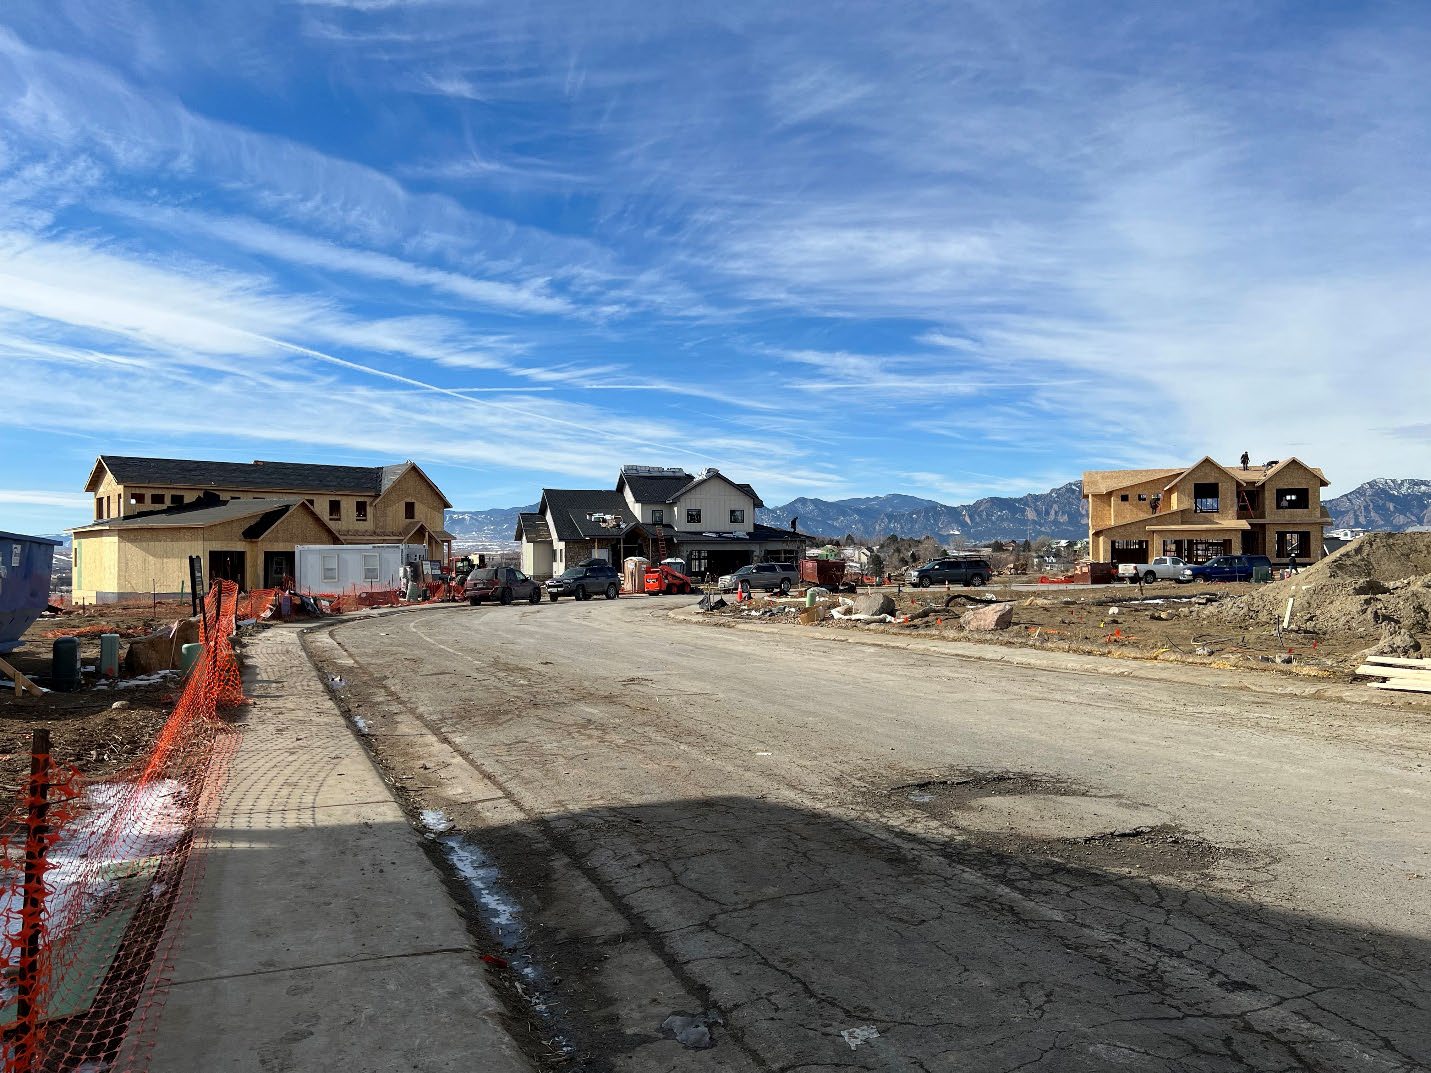
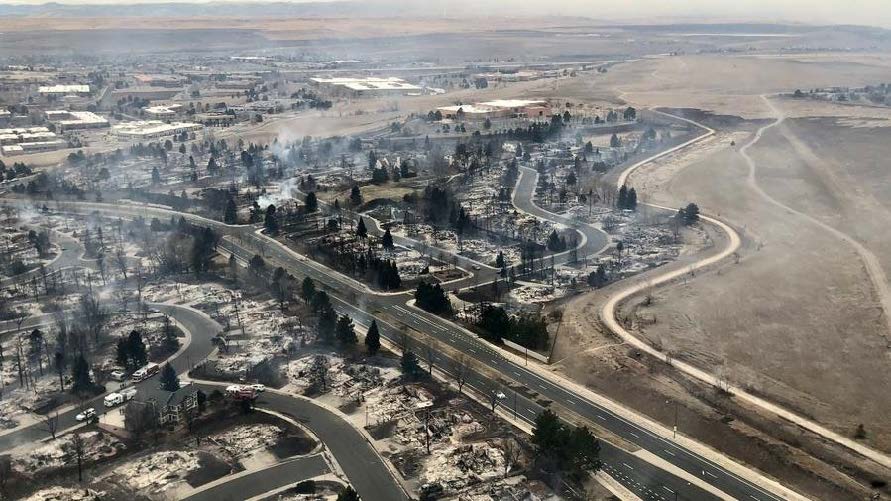
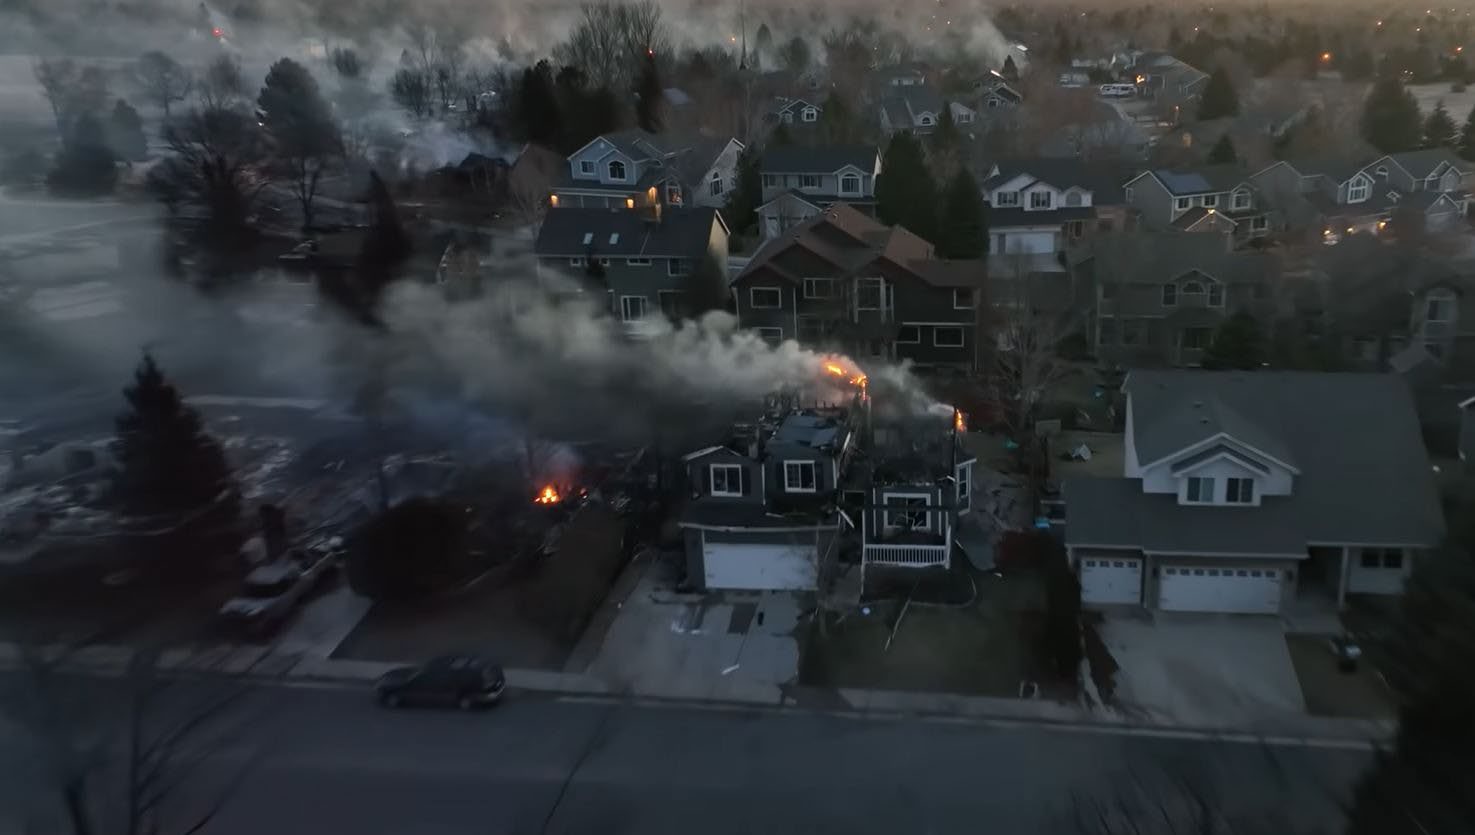
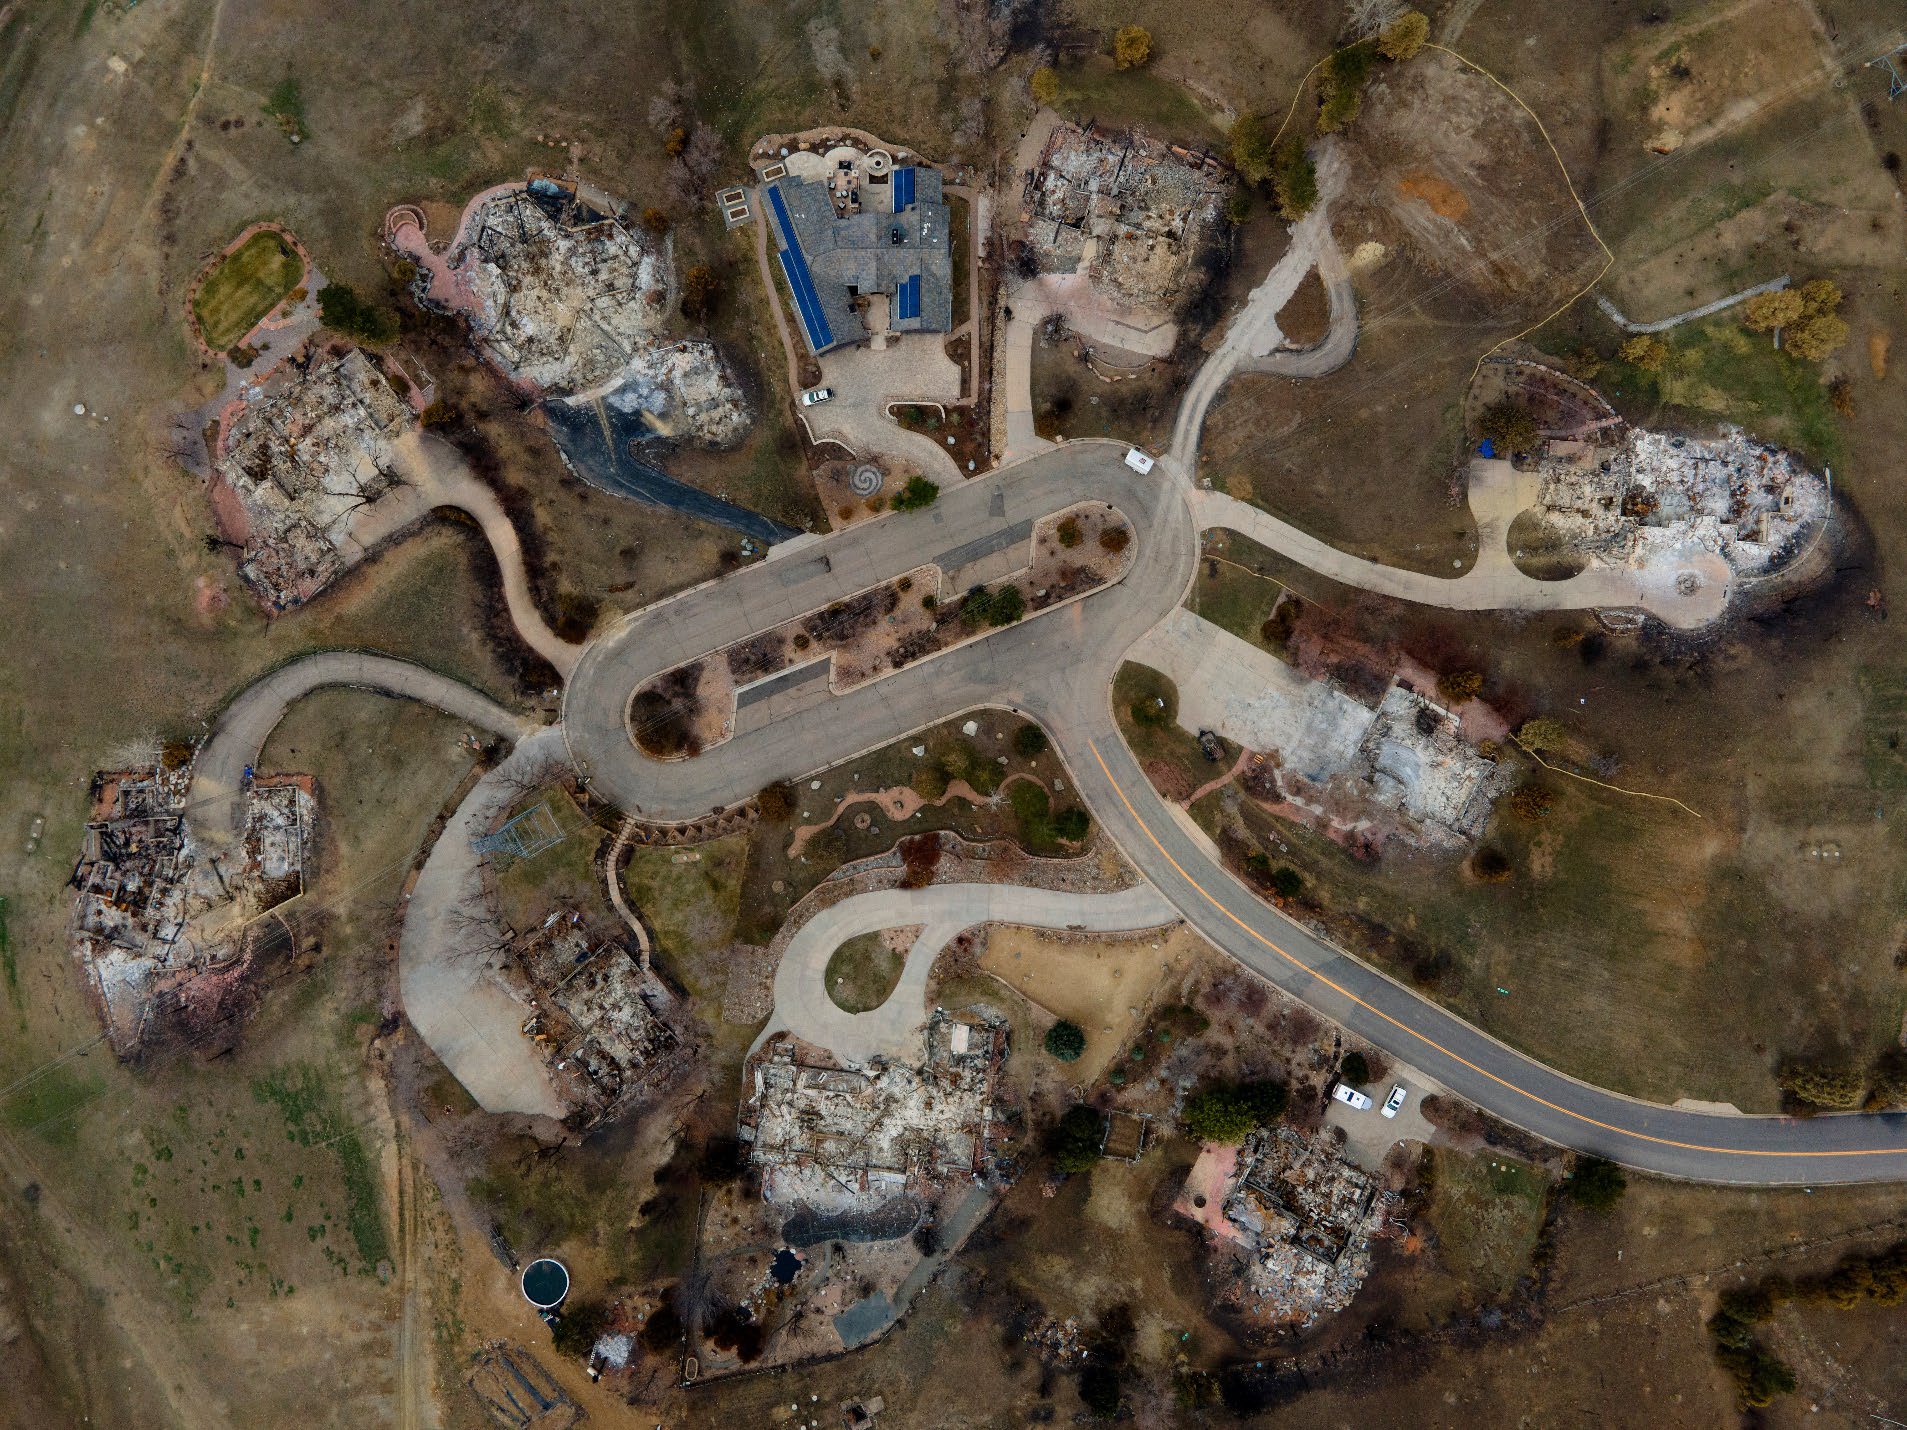
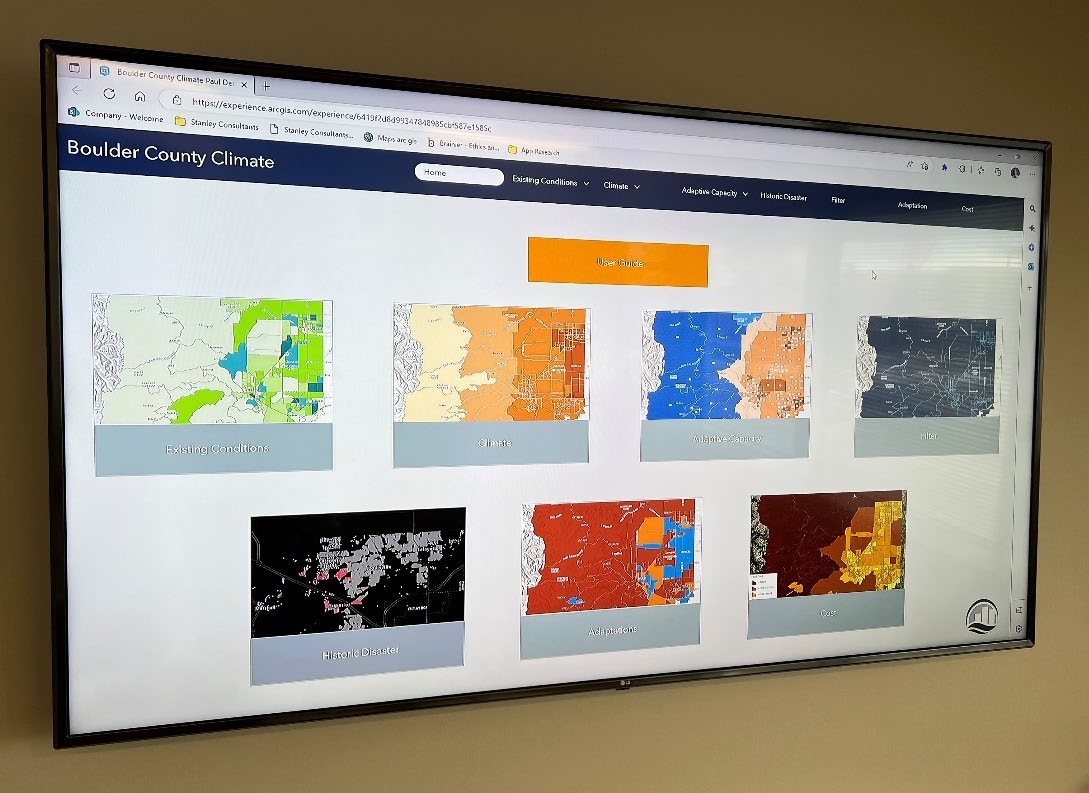
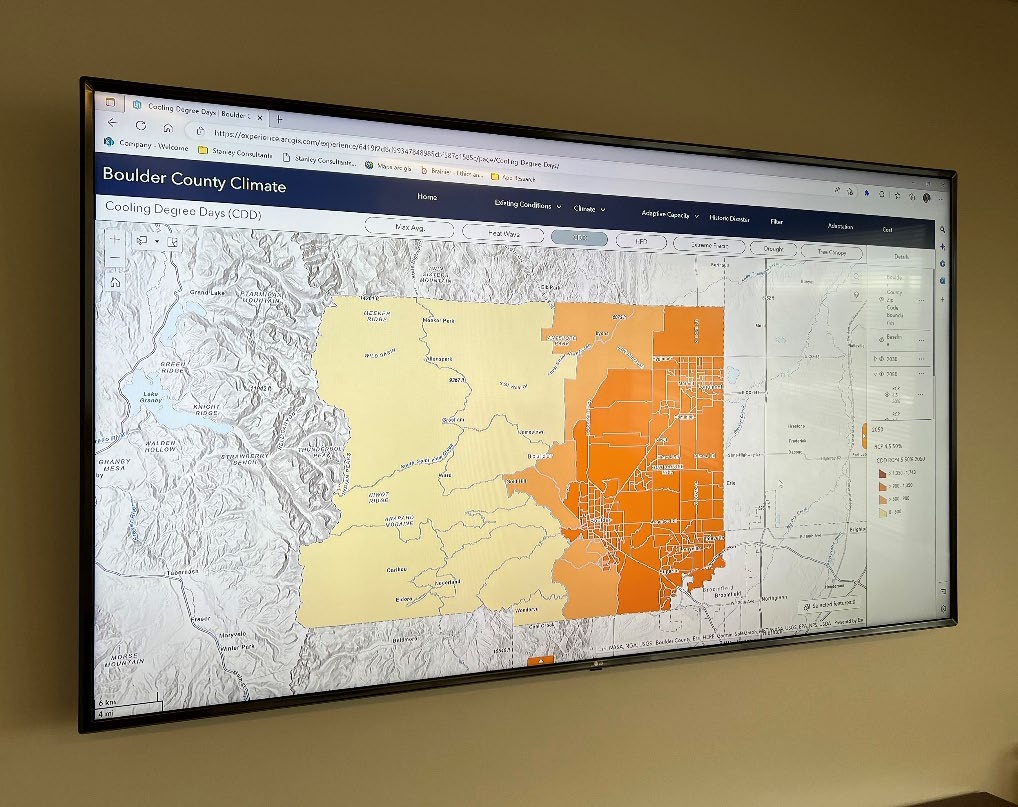
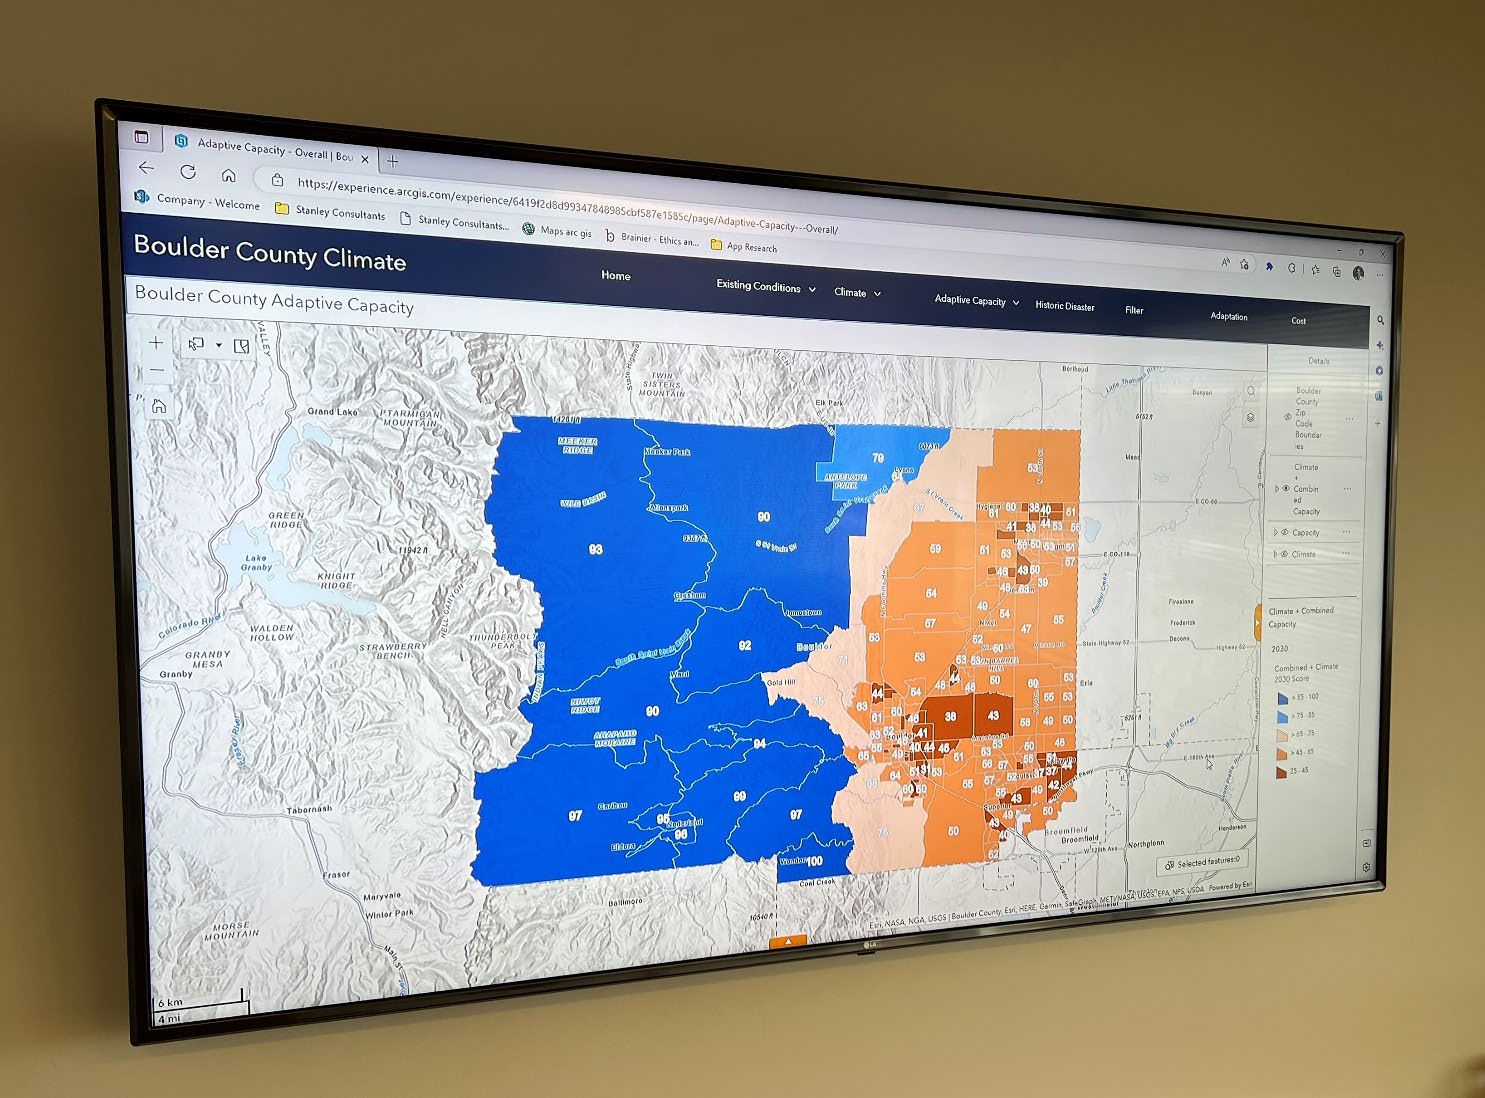
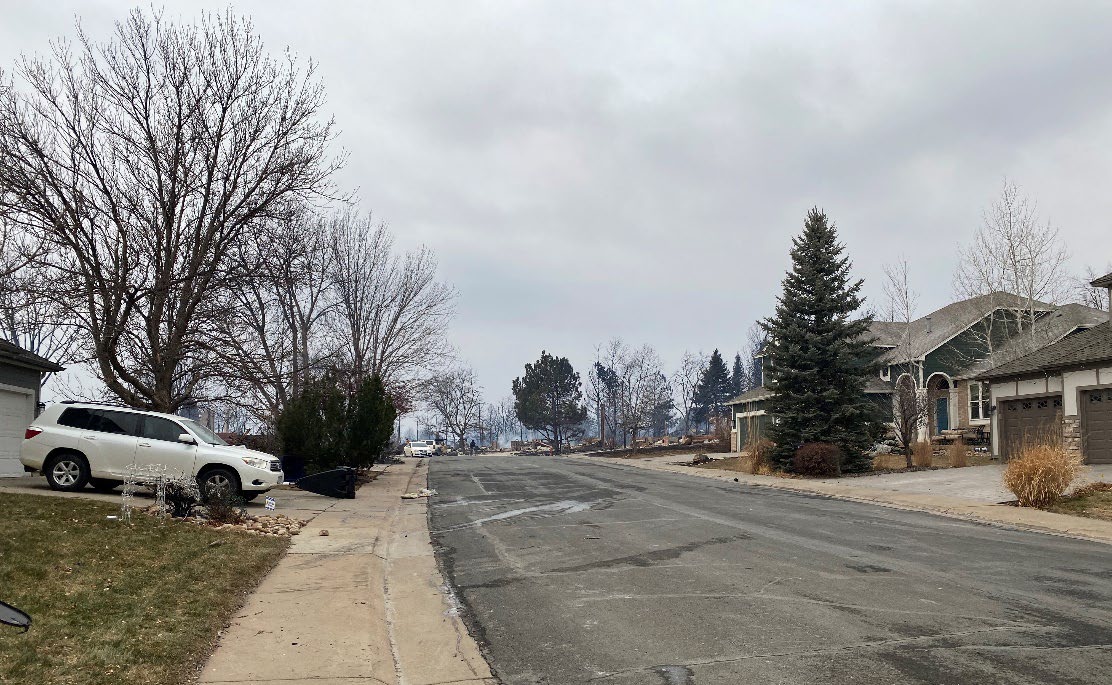
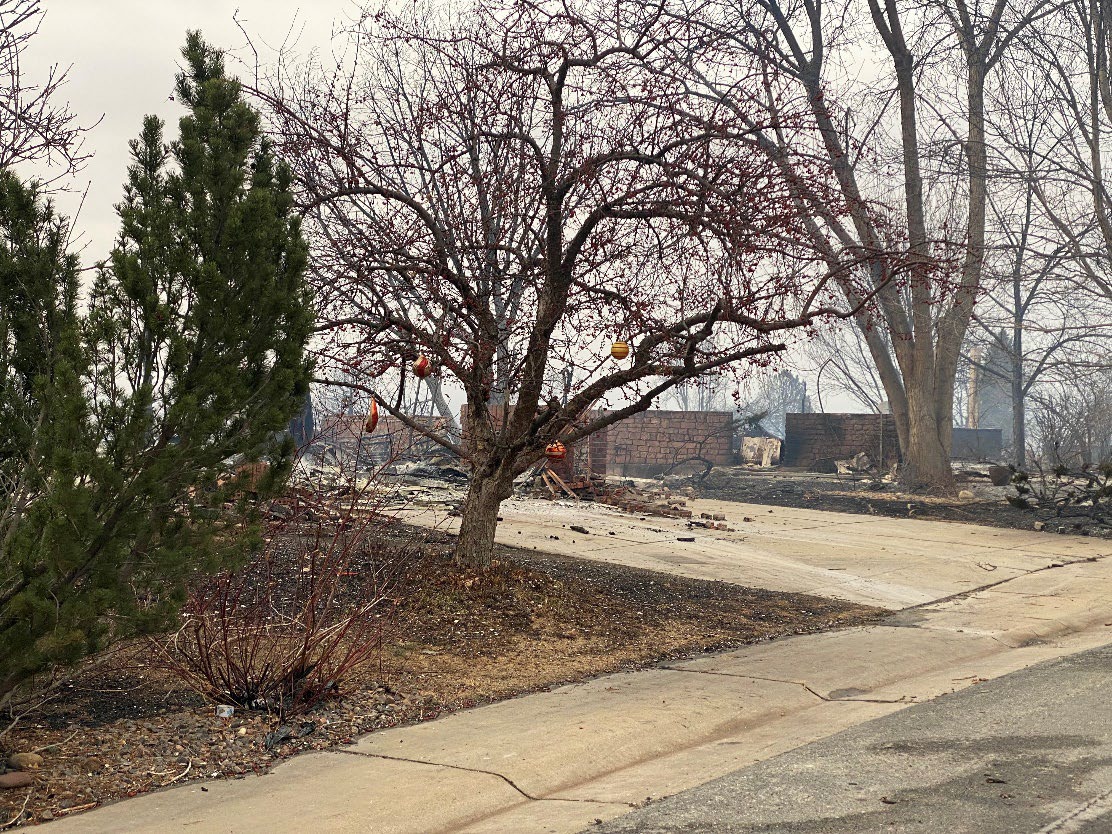
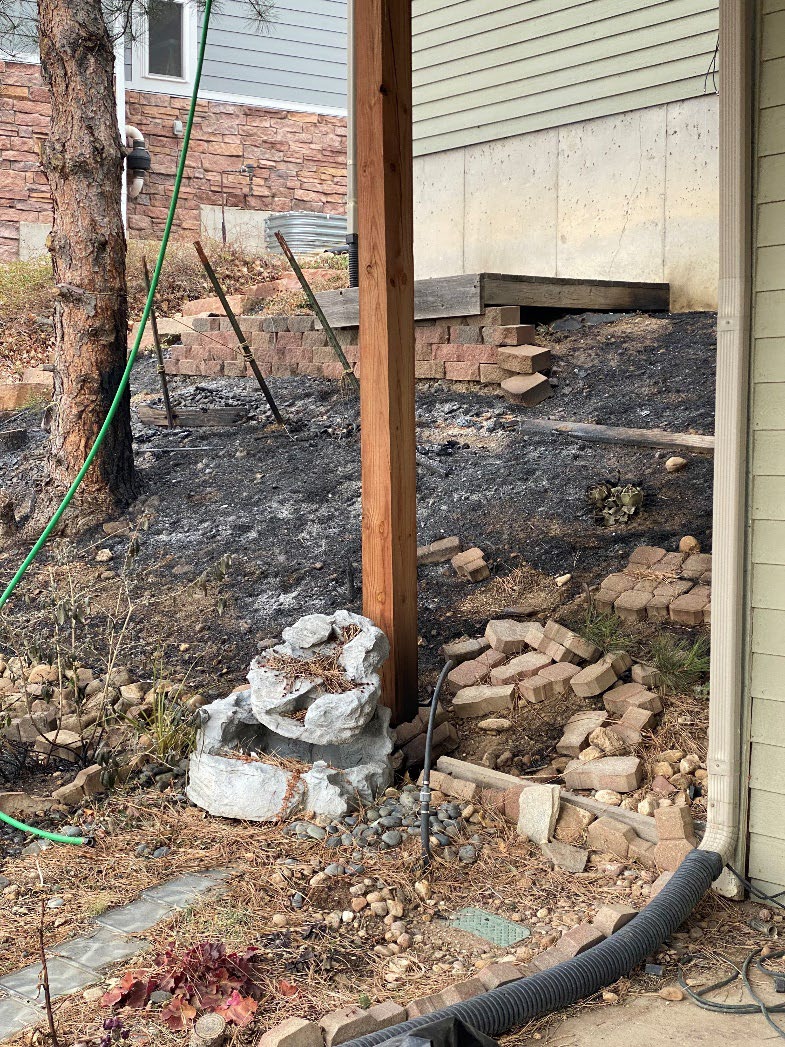
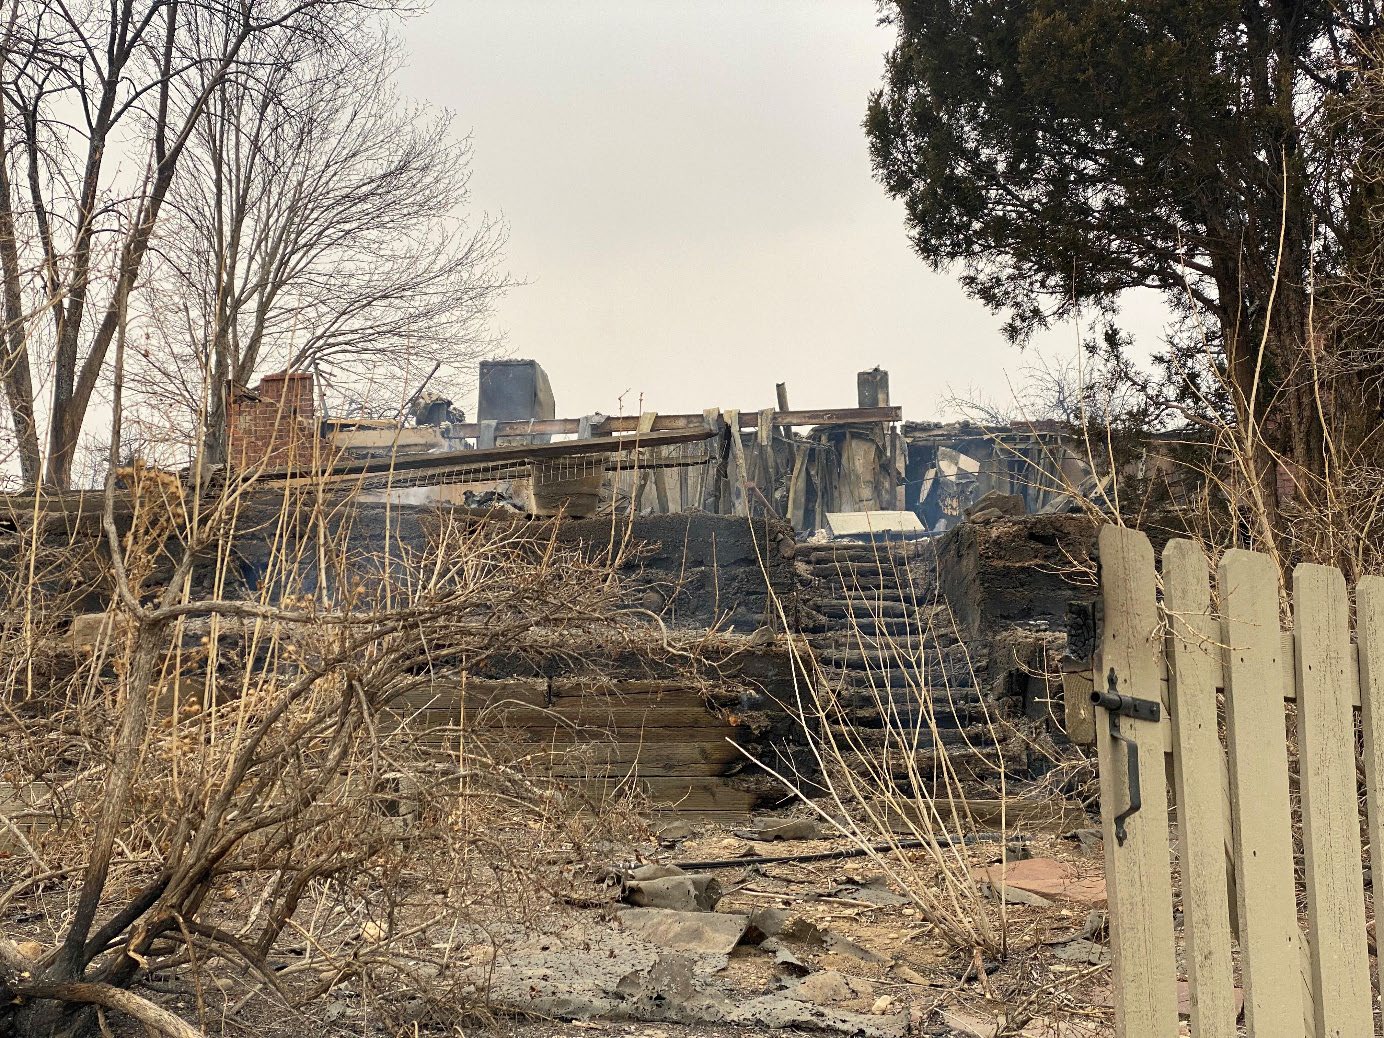
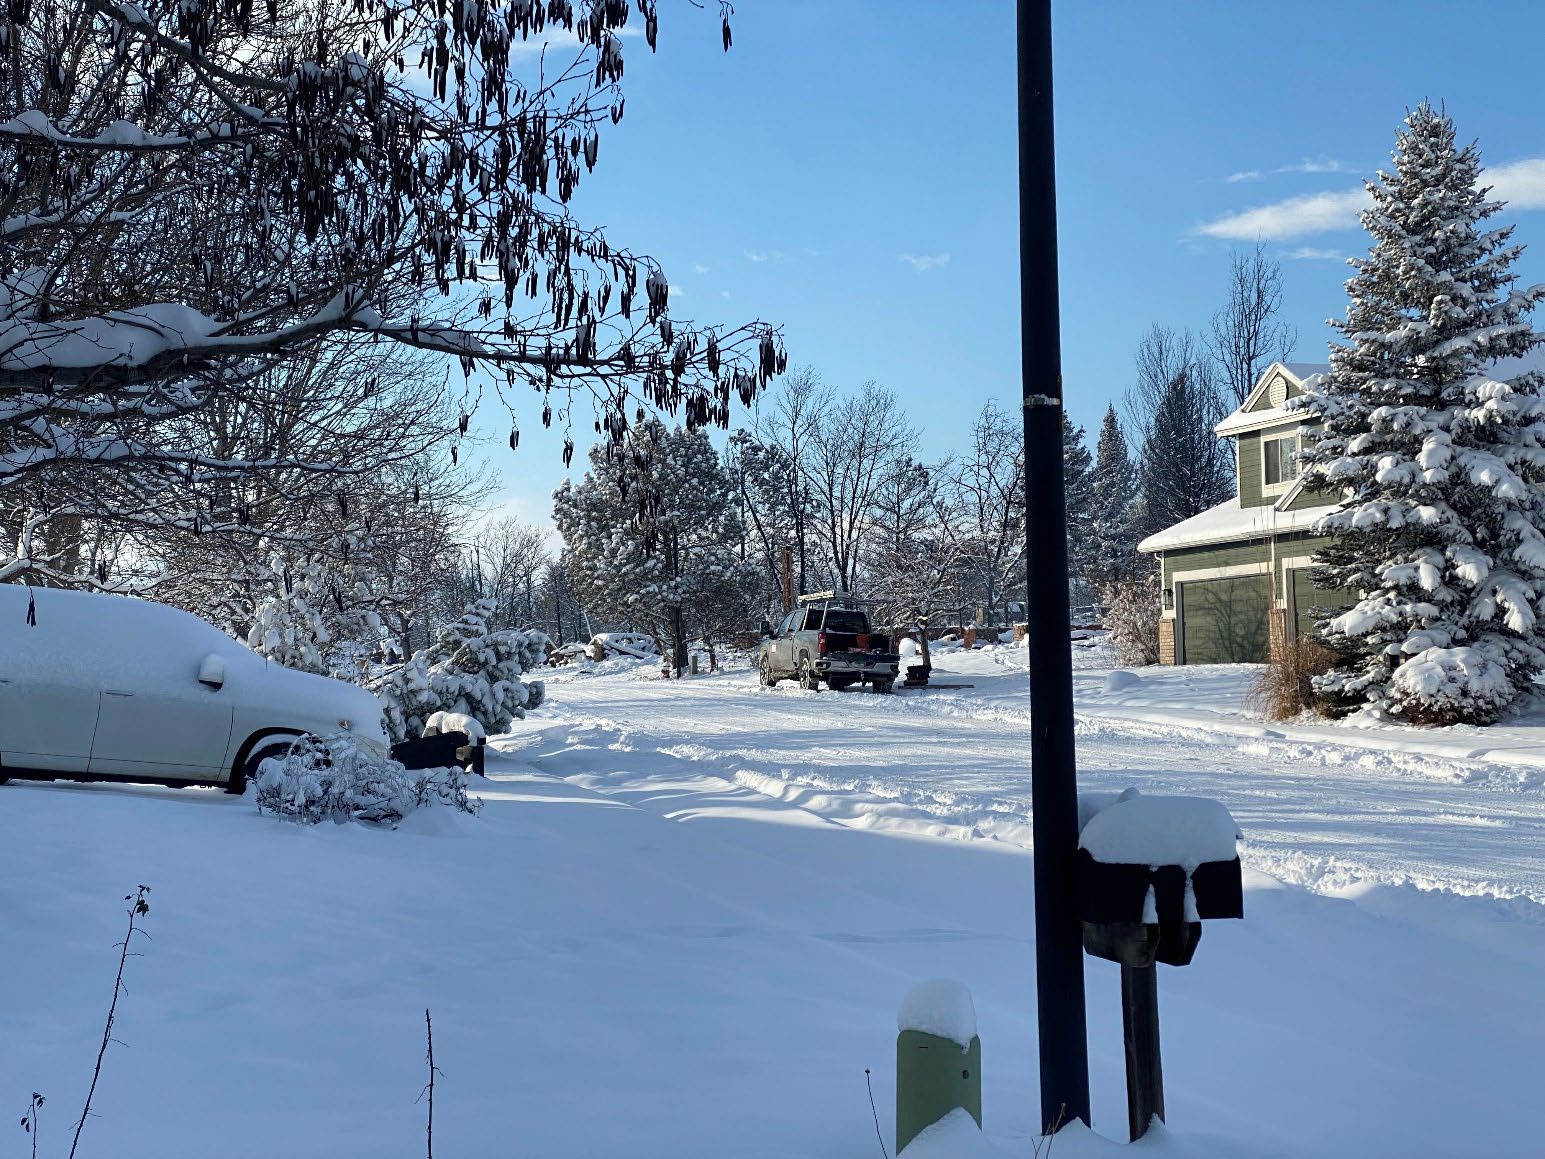
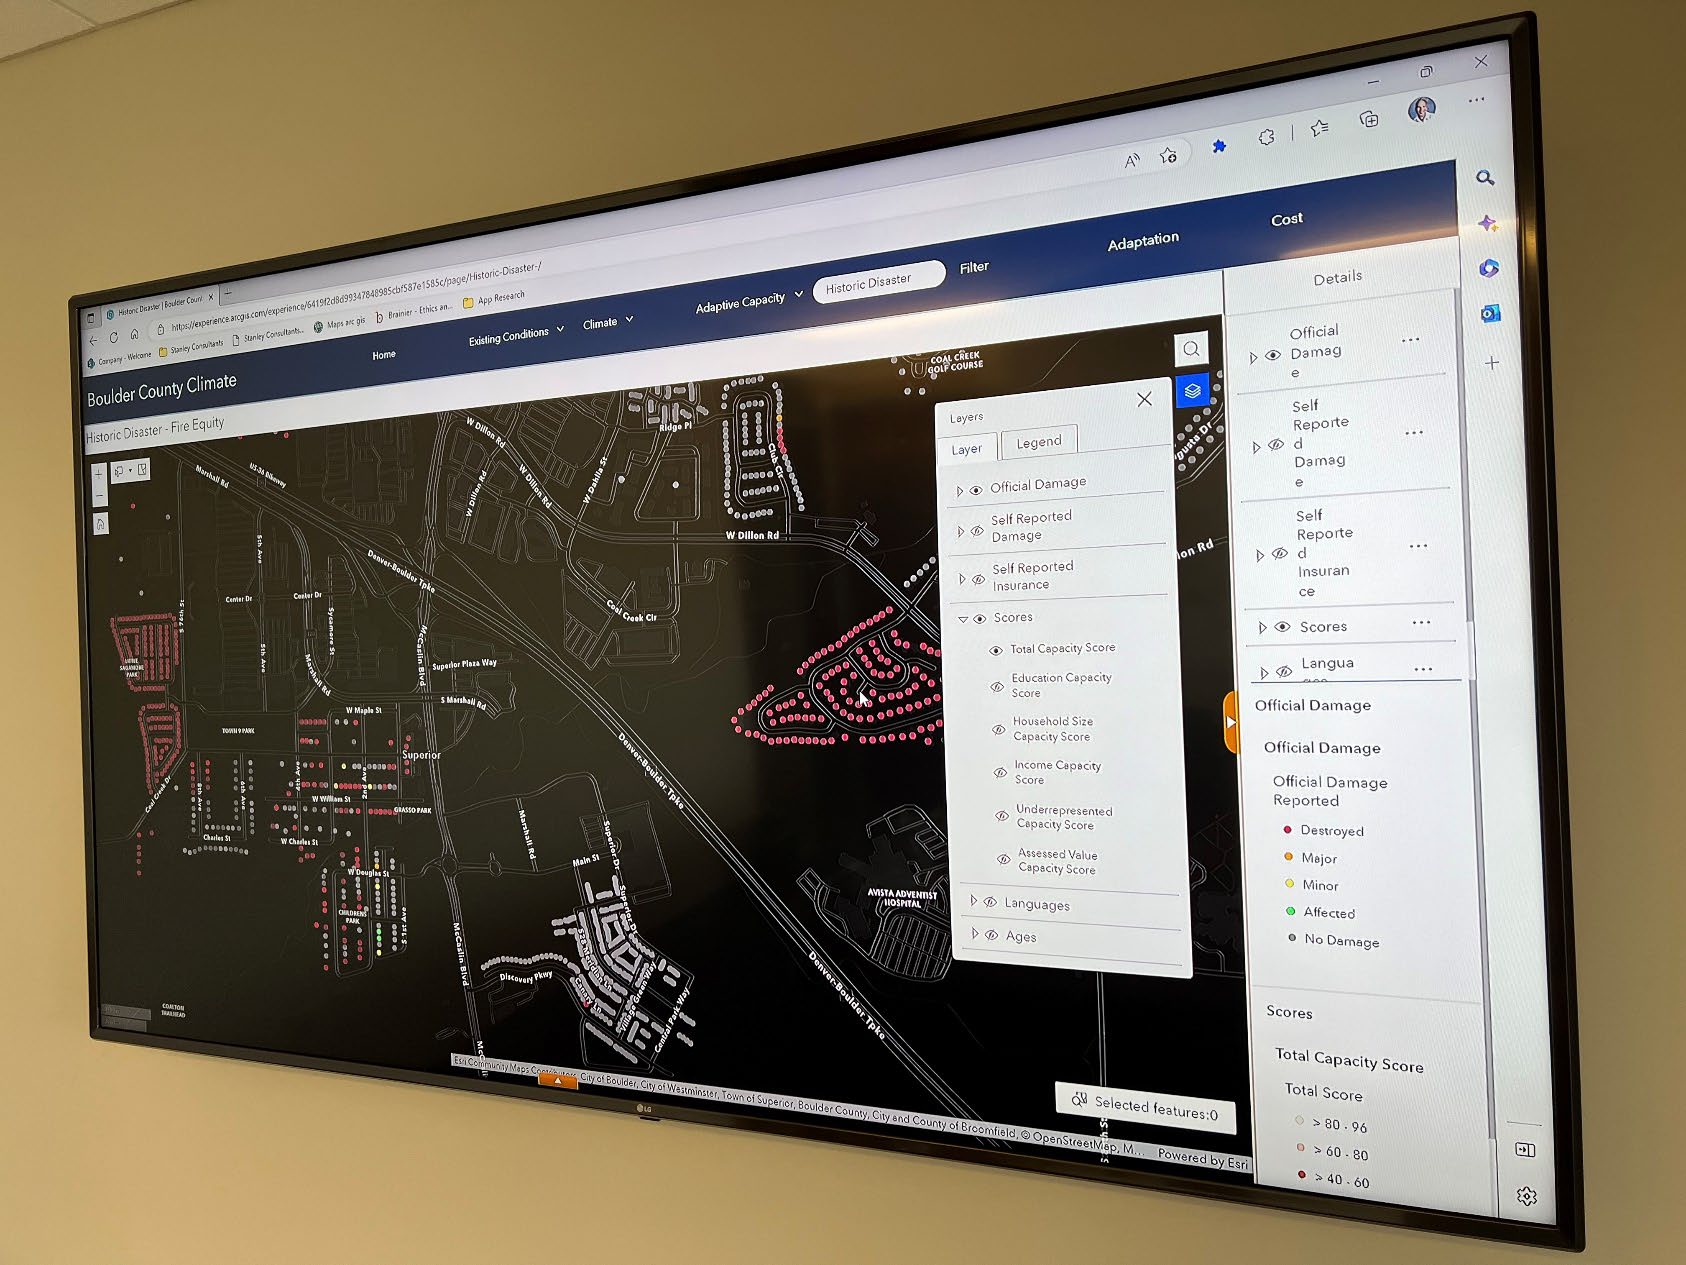
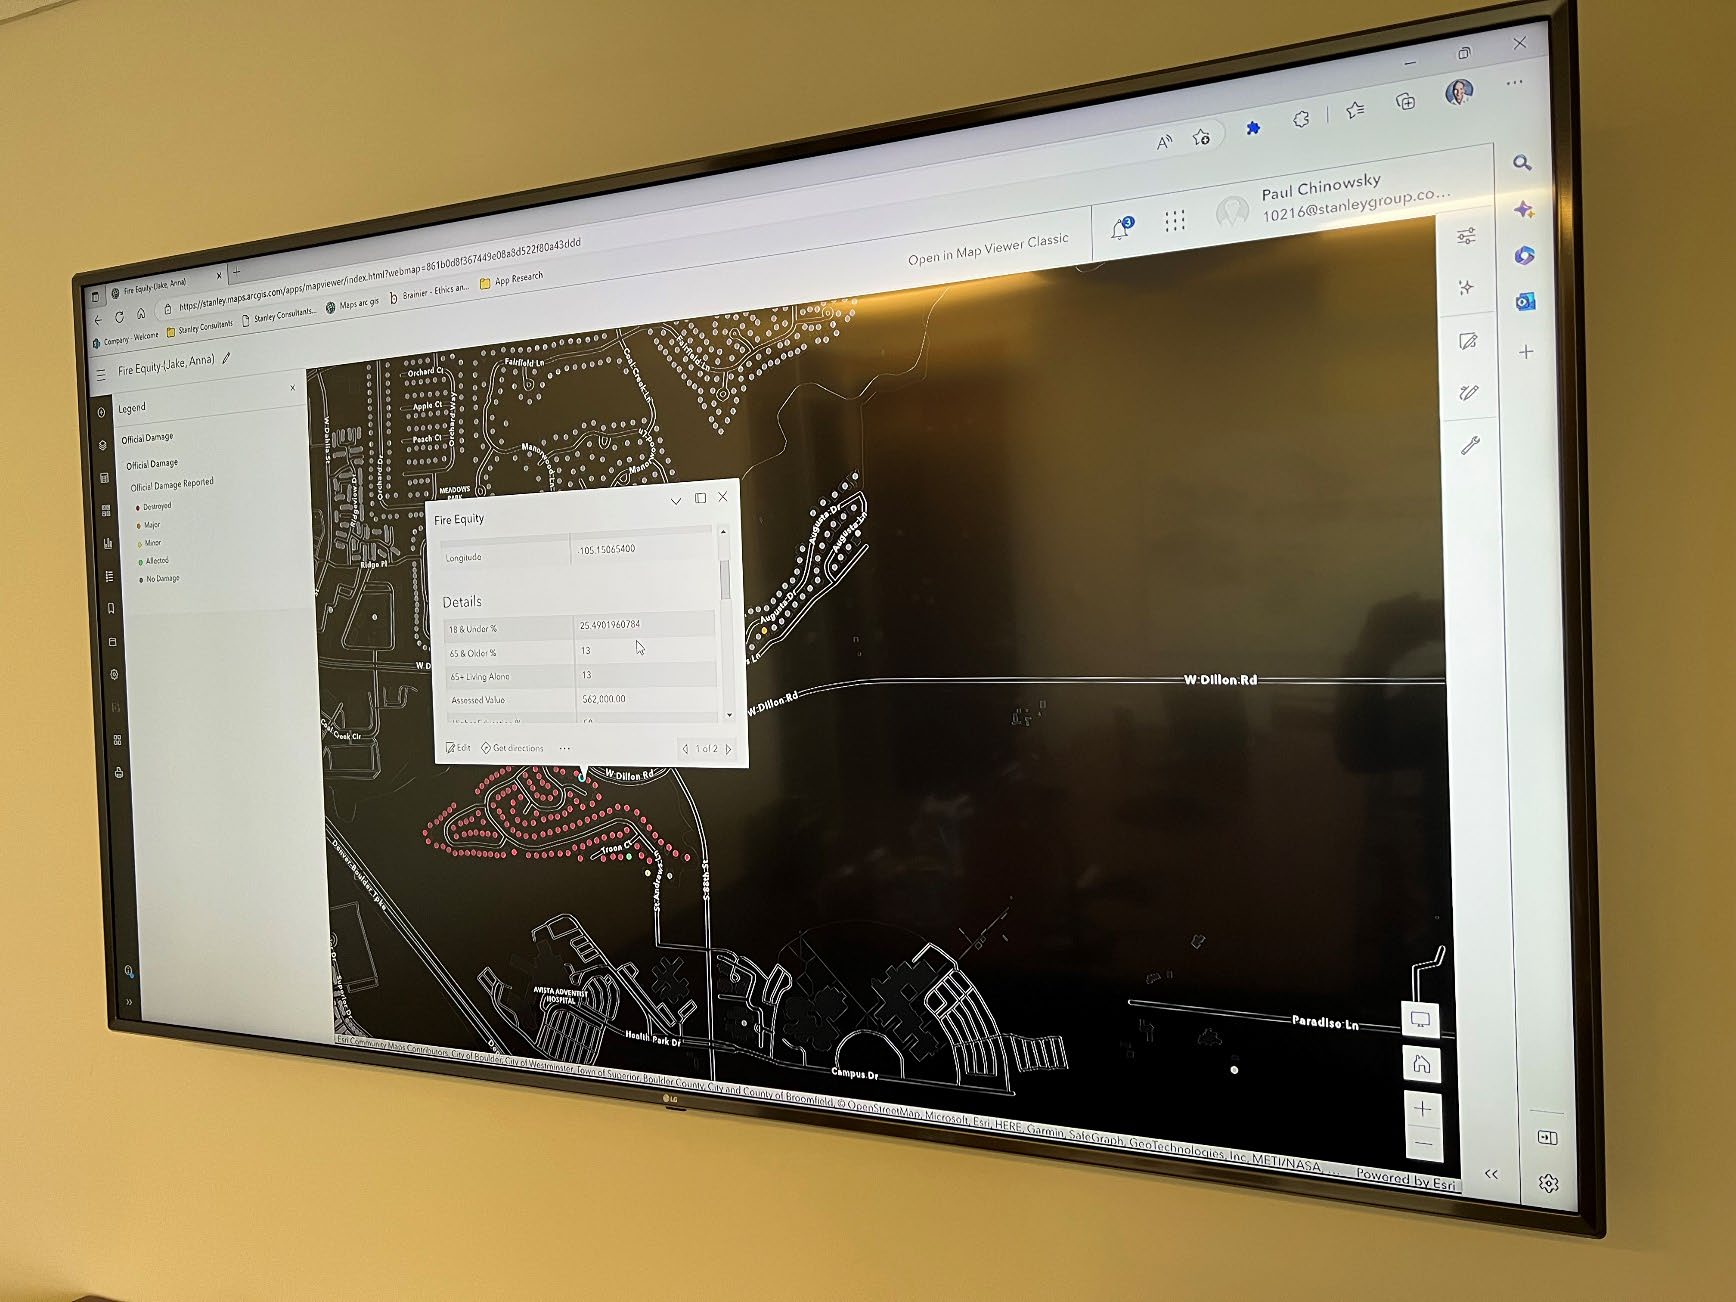
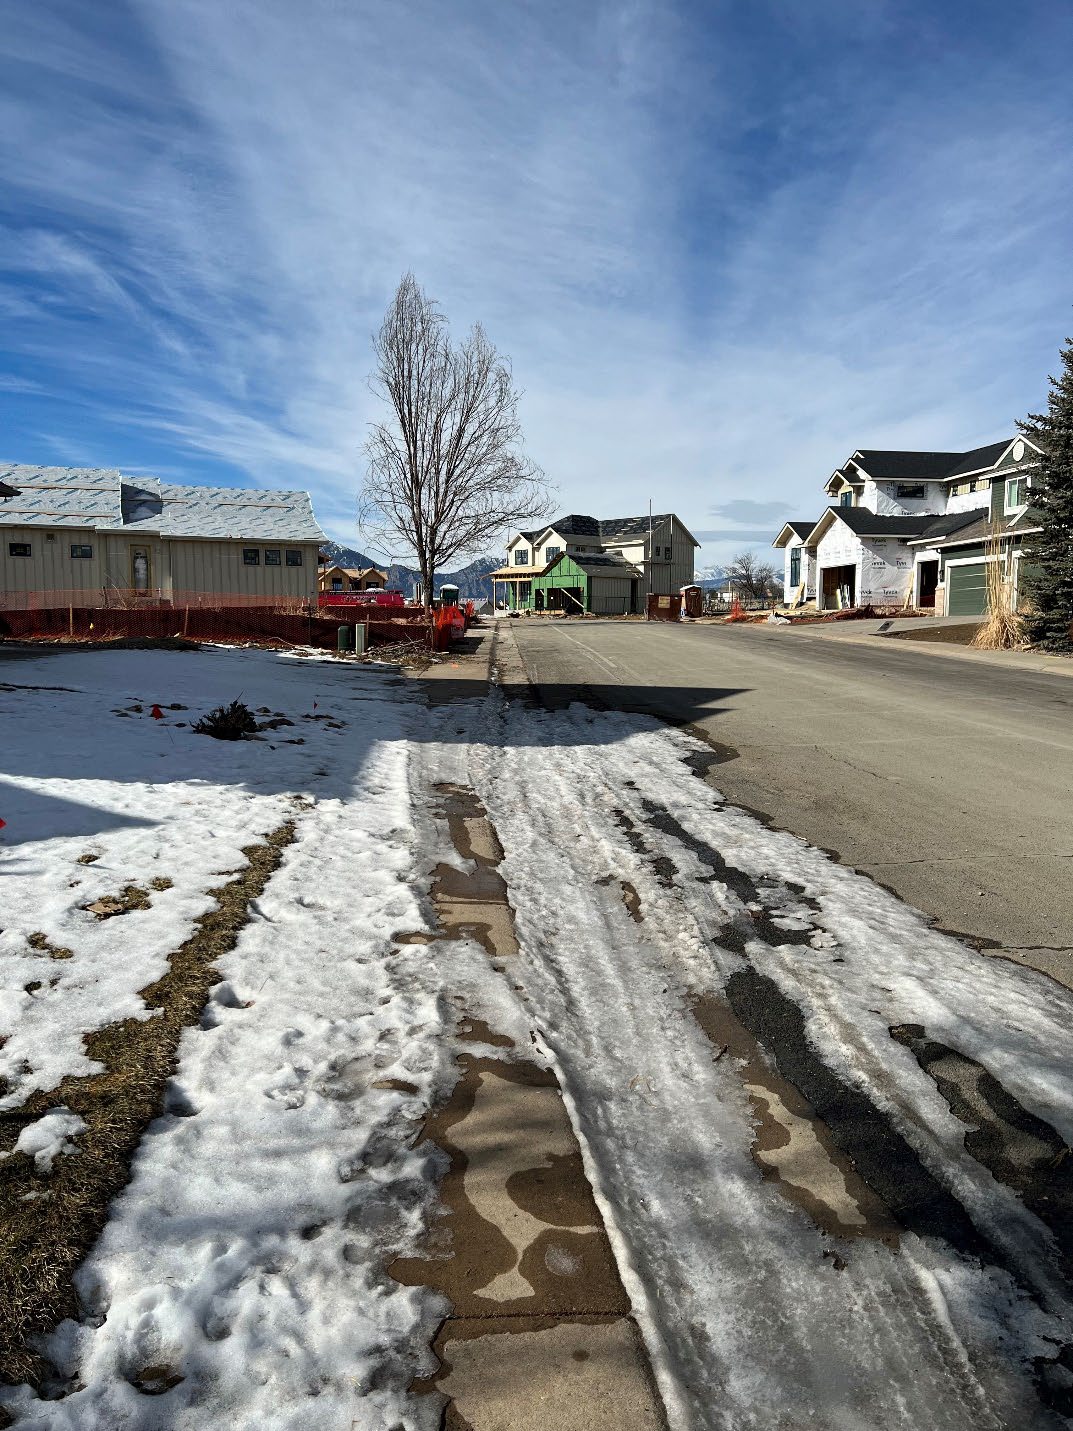
Honor Award - Small ProjectsDisaster Equity Reconstruction After the Marshall FireEntrant: Resilient Analytics, A Stanley Consultants Company Entrant Profile Driven by hurricane-force winds, the Marshall Fire swept through drought-stricken Boulder County, Colorado, on Dec. 30, 2021. It killed two people and incinerated or damaged more than 2,000 homes, and 30 commercial structures. Causing $2 billion in damages, it is the most destructive fire in Colorado history. Afterward, everyone impacted by the fire needed help. The critical question facing Boulder County was how to determine who needed to be helped first. Thanks to strategic planning by Boulder County officials, an equity mapping tool was already under development. Resilient Analytics, a local climate science firm, had been working with the county to develop a tool that incorporates socioeconomic data into an interactive map, identifying climate risks in the county all the way down to individual neighborhoods. The county was testing the tool when the Marshall Fire sparked. Resilient Analytics was able to quickly pivot to customize the tool to map fire damage and socioeconomic conditions in each neighborhood. The resulting tool includes filters that allowed the county to look at different factors: socioeconomic background, household value, residents' age, language barriers for residents, level of insurance, underrepresentation and education levels. The filters then allowed Boulder County officials to determine which households had the highest need for aid and other resources. It helped move those in need of additional assistance to the front of the line. The county plans to use it going forward, both for equity in natural disaster recovery and in resilience planning. Project DescriptionCOMPREHENSIVE INTEGRATED APPROACHThe Boulder County Equity Map was originally created to aid the county in meeting its 2030 GHG climate goal and attaining carbon neutrality by 2035. The interactive mapping tool / application (app) was developed by Resilient Analytics (RA) for the county’s Sustainability and Climate Office to determine which method of outreach was most effective in creating an interest in climate change and adaptation, based on the profile of the targeted recipient. Following the Marshall Fire, Boulder County asked RA to modify the tool to focus entirely on the 2000 households impacted by the fire. The goal was a GIS-based platform that integrates existing land use data, existing social demographic data, future climate projections and future adaptation land use planning to establish an integrated risk and capacity score at the neighborhood level that the county could use to provide reconstruction assistance to residents. In response, RA complied over 500,000 datapoints of information. Publicly available census data provided broad picture information such as household size, education, household income and primary language. The county tax assessor provided information on the purchase date, price and square footage of each home. Damage estimates from both residents and the county were used to create a damage rating scale. Already compiled were environmental analysis such as wildfire and flood risk, air quality and climate projections through 2050. RA complied the data into a searchable database able to process complex queries and display the results in a map with multiple layers that can be turned on or off. The resulting map allows the county to identify the under-represented communities and zero in on the most vulnerable households with the least capacity to rebuild and tailor its outreach to meet their needs. Moving forward from the fire, the county will use the map for land use planning, zoning and emergency management. “We are using it as guidance for all programming across from sustainable ag to electric to meet climate goals,” said Brett Fleishman, Boulder County Senior Climate Strategist.
QUALITY by USER SATISFACTION and PROVEN PERFORMANCEThe equity map functions as designed. It successfully identified and highlighted the households that were most in need of assistance after the Marshall Fire. It also revealed that those most in need of assistance also had the least amount of time available to work through FEMA, insurance companies, etc. to get assistance. Boulder County has been completely satisfied with the scientific detail of the equity map. “As a local government we need to start viewing communities through these lenses. This data is fundamental now adays,” said Boulder County Senior Climate Strategist Brett Fleishman. “We need to see layers of our community based on vulnerability and climate impacts to see where the dangers are.” Not only have other agencies within the county adopted the Equity map but Boulder County is actively advocating that something similar be developed throughout Colorado. “Despite the accelerated timeline and moving criteria, RA was able to quickly provide a tool that not only met but exceeded the county’s expectations. On a scale of 1 to 10, we would give RA a 12,” said Fleishman.
ORIGINALTY and INNOVATIONThe equity map represents a nationwide “first ever” innovation on two levels. It is an original tool that has never been created before. To our knowledge, the initial equity map is the first of its kind in the country. “We’re navigating new territory,” said Fleishman. “It’s fundamental information but nobody is holding it.” The map represents the first time that existing land use data, existing social data and future climate projections at a neighborhood level were brought together to inform land use and planning. Likewise, the more focused map created for the Marshall Fire went a few steps further, pulling together granular data at the household level and looked at it from a perspective of recovery and future resilience. It is also thought to be the first of its kind in the United States. The fire prompted questions of how to obtain focused information about individual households during an emergency situation. While there are multiple maps in existence about response following natural disasters, the equity map is the first of its kind that brings together both social factors and damage that allows for an immediate evaluation using a tool accessible to all.
COMPLEXITY“It was insanely complex,” said Boulder County Senior Climate Strategist Brett Fleishman. The first challenge was determining what information should be included. In a non-emergency situation, RA would have thoughtfully queried all parties expected to use the equity map to determine exactly what information should be included before proceeding to the next step. However, due to the urgency created by the fire, data was gathered and added in a piecemeal approach as “eureka” moments led to the realization that additional specific data would be useful. Ultimately 500,000 datapoints were compiled and uploaded into the map from over 20 databases - climate, census, tax assessors, demographic, etc. The next monumental challenge lay in combining, formatting and linking the datapoints in a manner so that it all worked together and when queried could produce accurate results. The results were phenomenal. The most fundamental layer of the Marshall Fire map shows the geographic outline of the fire. Additional layers can be turned on or off such as household size, education score, income level, etc.
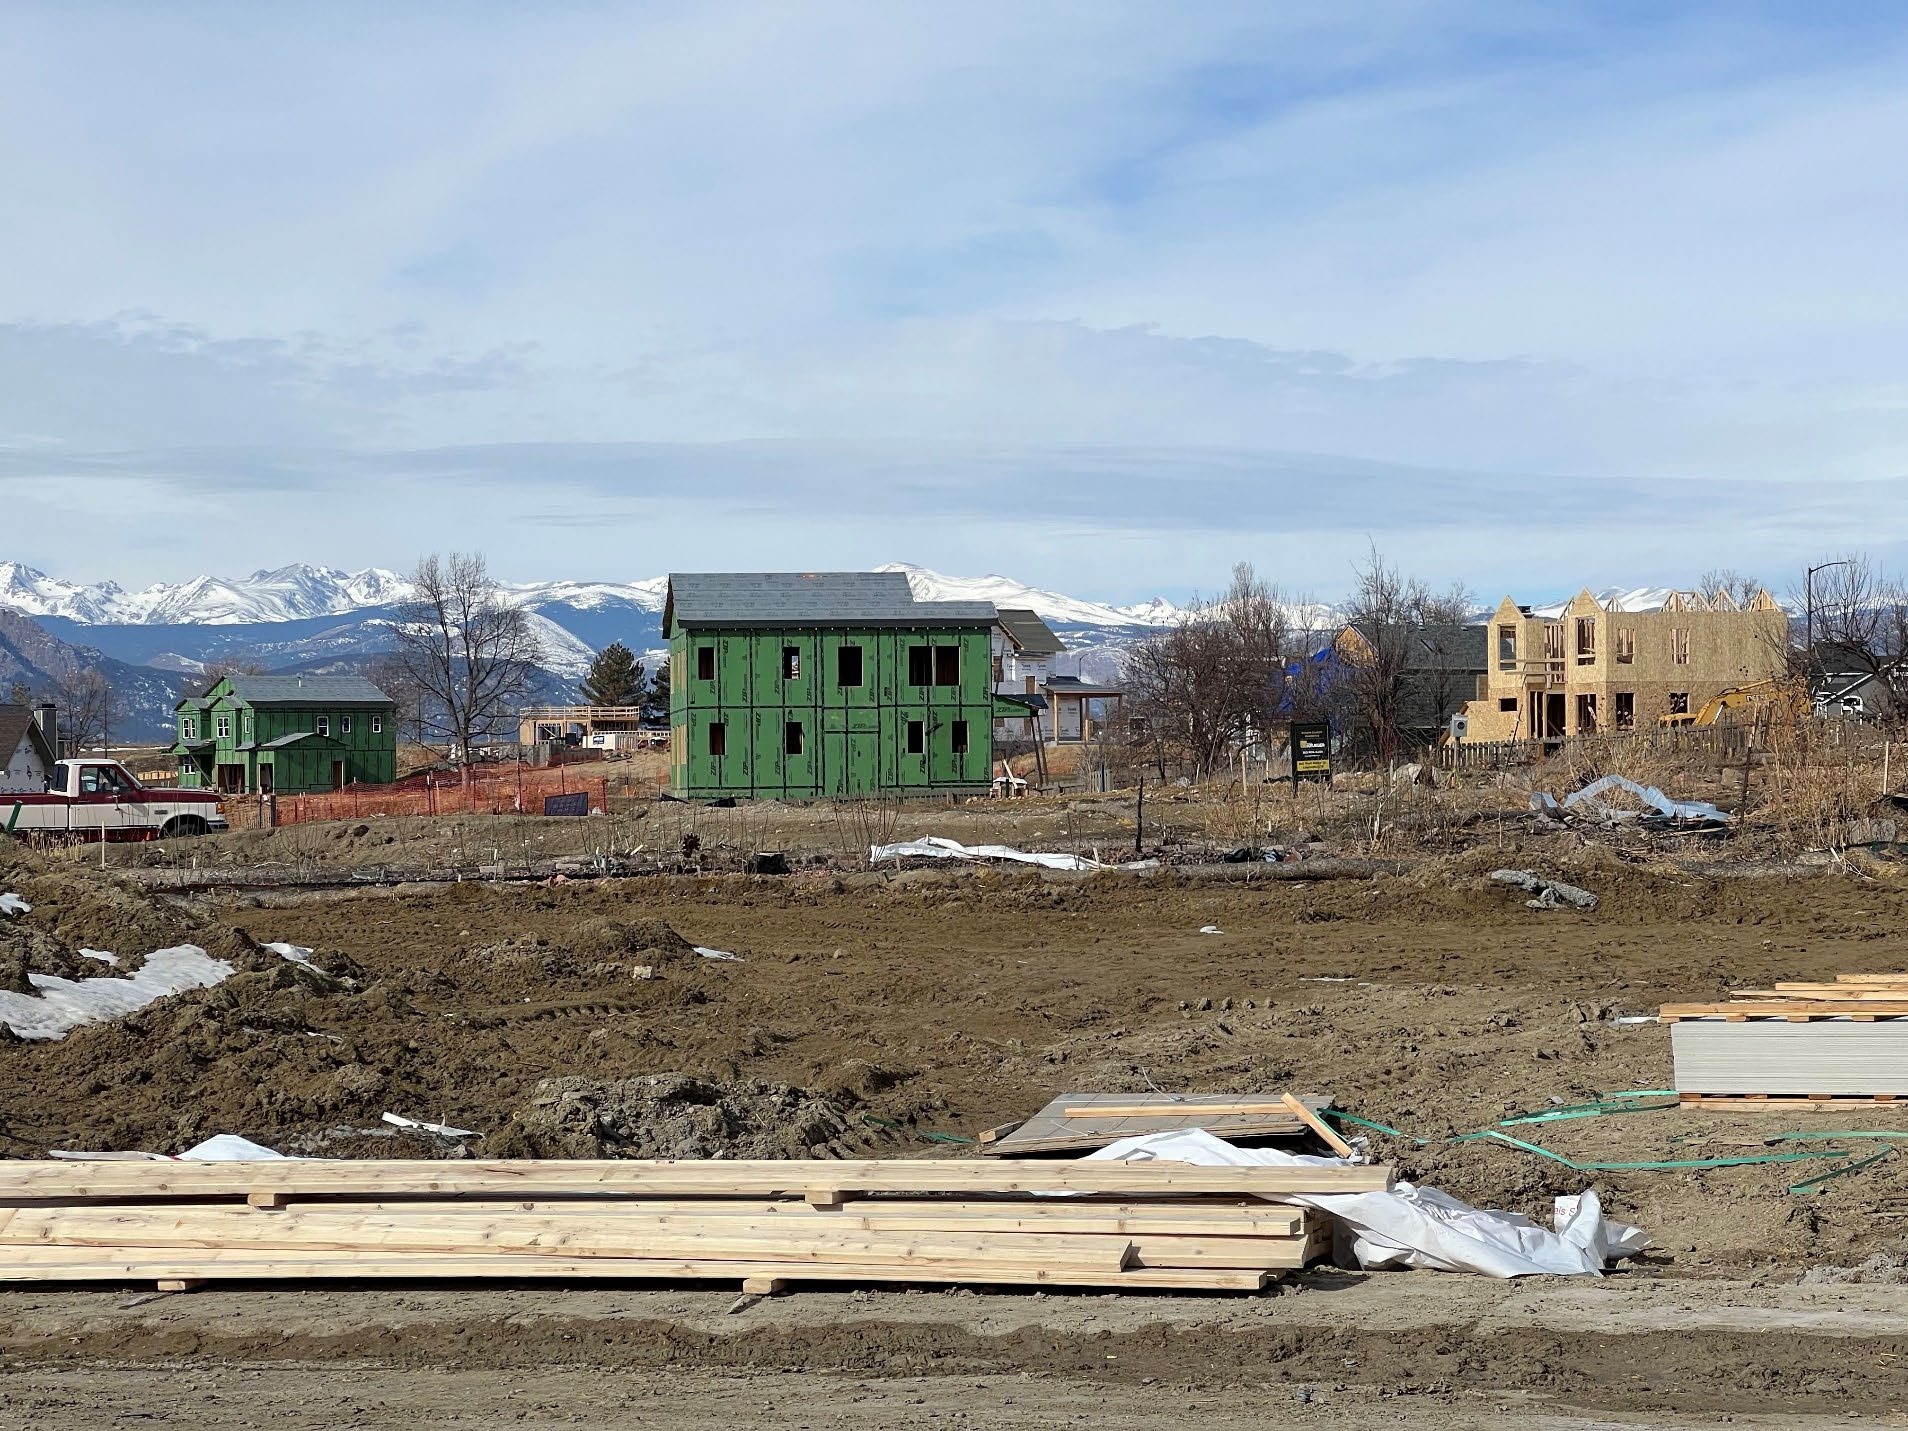
SOCIAL and ECONOMIC ADVANCEMENTThe hallmark of climate change is that it doesn’t affect everyone equally. Globally, households that have contributed the least in terms of greenhouse gas per capita are impacted the most by climate change on average. And those who have been marginalized in the past are disproportionally impacted. The equity map made it possible for Boulder County to successfully identify the residents most vulnerable and in need of assistance after the fire and move them to the front of the line. As a result, the rebuilding efforts are taking place more evenly across the county rather than the highest income households rebuilding first.
Click images to enlarge in separate window.
Click here to return to the list of 2023 winners. |

Our Partners